Copyright Notice: This article is Copyright AI Factory Ltd. Ideas and code belonging to AI Factory may only be used with the direct written permission of AI Factory Ltd.
This is a follow-on of the topics Digging further into the Statistical Abyss, which looked at the pitfalls of assessing multiple test results, and Statistical Minefields with Version Testing, which looked at assessing block round-robin tests.
The lessons from above were that assessing multiple test results offered many pitfalls, because very easily one among many tests could be an outlier. It also showed that single tests often needed very large numbers of test results before becoming significant.
This article is specifically centred on the imperfect information card game of "Spades" and it can be shown here than the issues of single tests can magnify substantially. The new test framework exposes this well.
Limitations imposed by Imperfect Information Games
Unlike perfect information games such as Chess, the result of any hand is vulnerable to random deals, so that this can add significant noise to test results. If we just tested open random deals, with an asymmetric set of hands for each side, then the number of deals needed might be huge. However, this issue can be reduced by making sure that both tested versions play both sides of each hand, so diminishing the influence of luck. We indeed do that.
Limitations imposed by the role of randomness in play outcome
If we were playing the simple card game "War" then we could assert that skill plays no part and the outcome is only determined by the deal. With Spades, clearly there is a substantial skill component, but the influence of random luck plays a large part in determining the outcome of any one hand. This dictates that we will have to run substantially longer tests than we would for a game such as Chess. The greater the luck factor, the greater the need for more tests.

The Binomial Distribution goes out the Window
Another very significant difference between assessing the Spades play results and games such as Chess is that our root BINOM program can no longer practically be used. If we tested on whole multi-hand games, as would be normal, this may consist of very many hands per game and testing could take forever. The outcome of such long games would also be limited to just a binomial win or lose, ignoring the significance of point scores.
However, if we speed it up instead to reduce a game to a single hand, then this becomes an artificial test as it ignores the points total. A setup based on winning or losing a single hand will not play in the best manner to maximise points, but just win or lose a single hand. Such a program would not play Spades well as this would inevitably ignore bags, which are essential in long games.
In consequence, a better strategy would be to play games with extremely high point targets, such as 200,000 points, in which case all hands would play to optimise gaining of points rather than just winning a hand. This makes better sense. Of course, this overlooks the quality of endgame play, but this is a fraction of the whole game which is otherwise dominated by the point win rate.
So, our assessment will not use the Binomial Distribution but instead be based on point totalling. In consequence, we lose this helpful reference "significance" test that asserts whether the test result is meaningful or not.
Testing a sample run
In the partner article Adding New Muscle to Our AI Testing there is a table showing the current full analysis of the Spades version testing. This is duplicated here for reference:
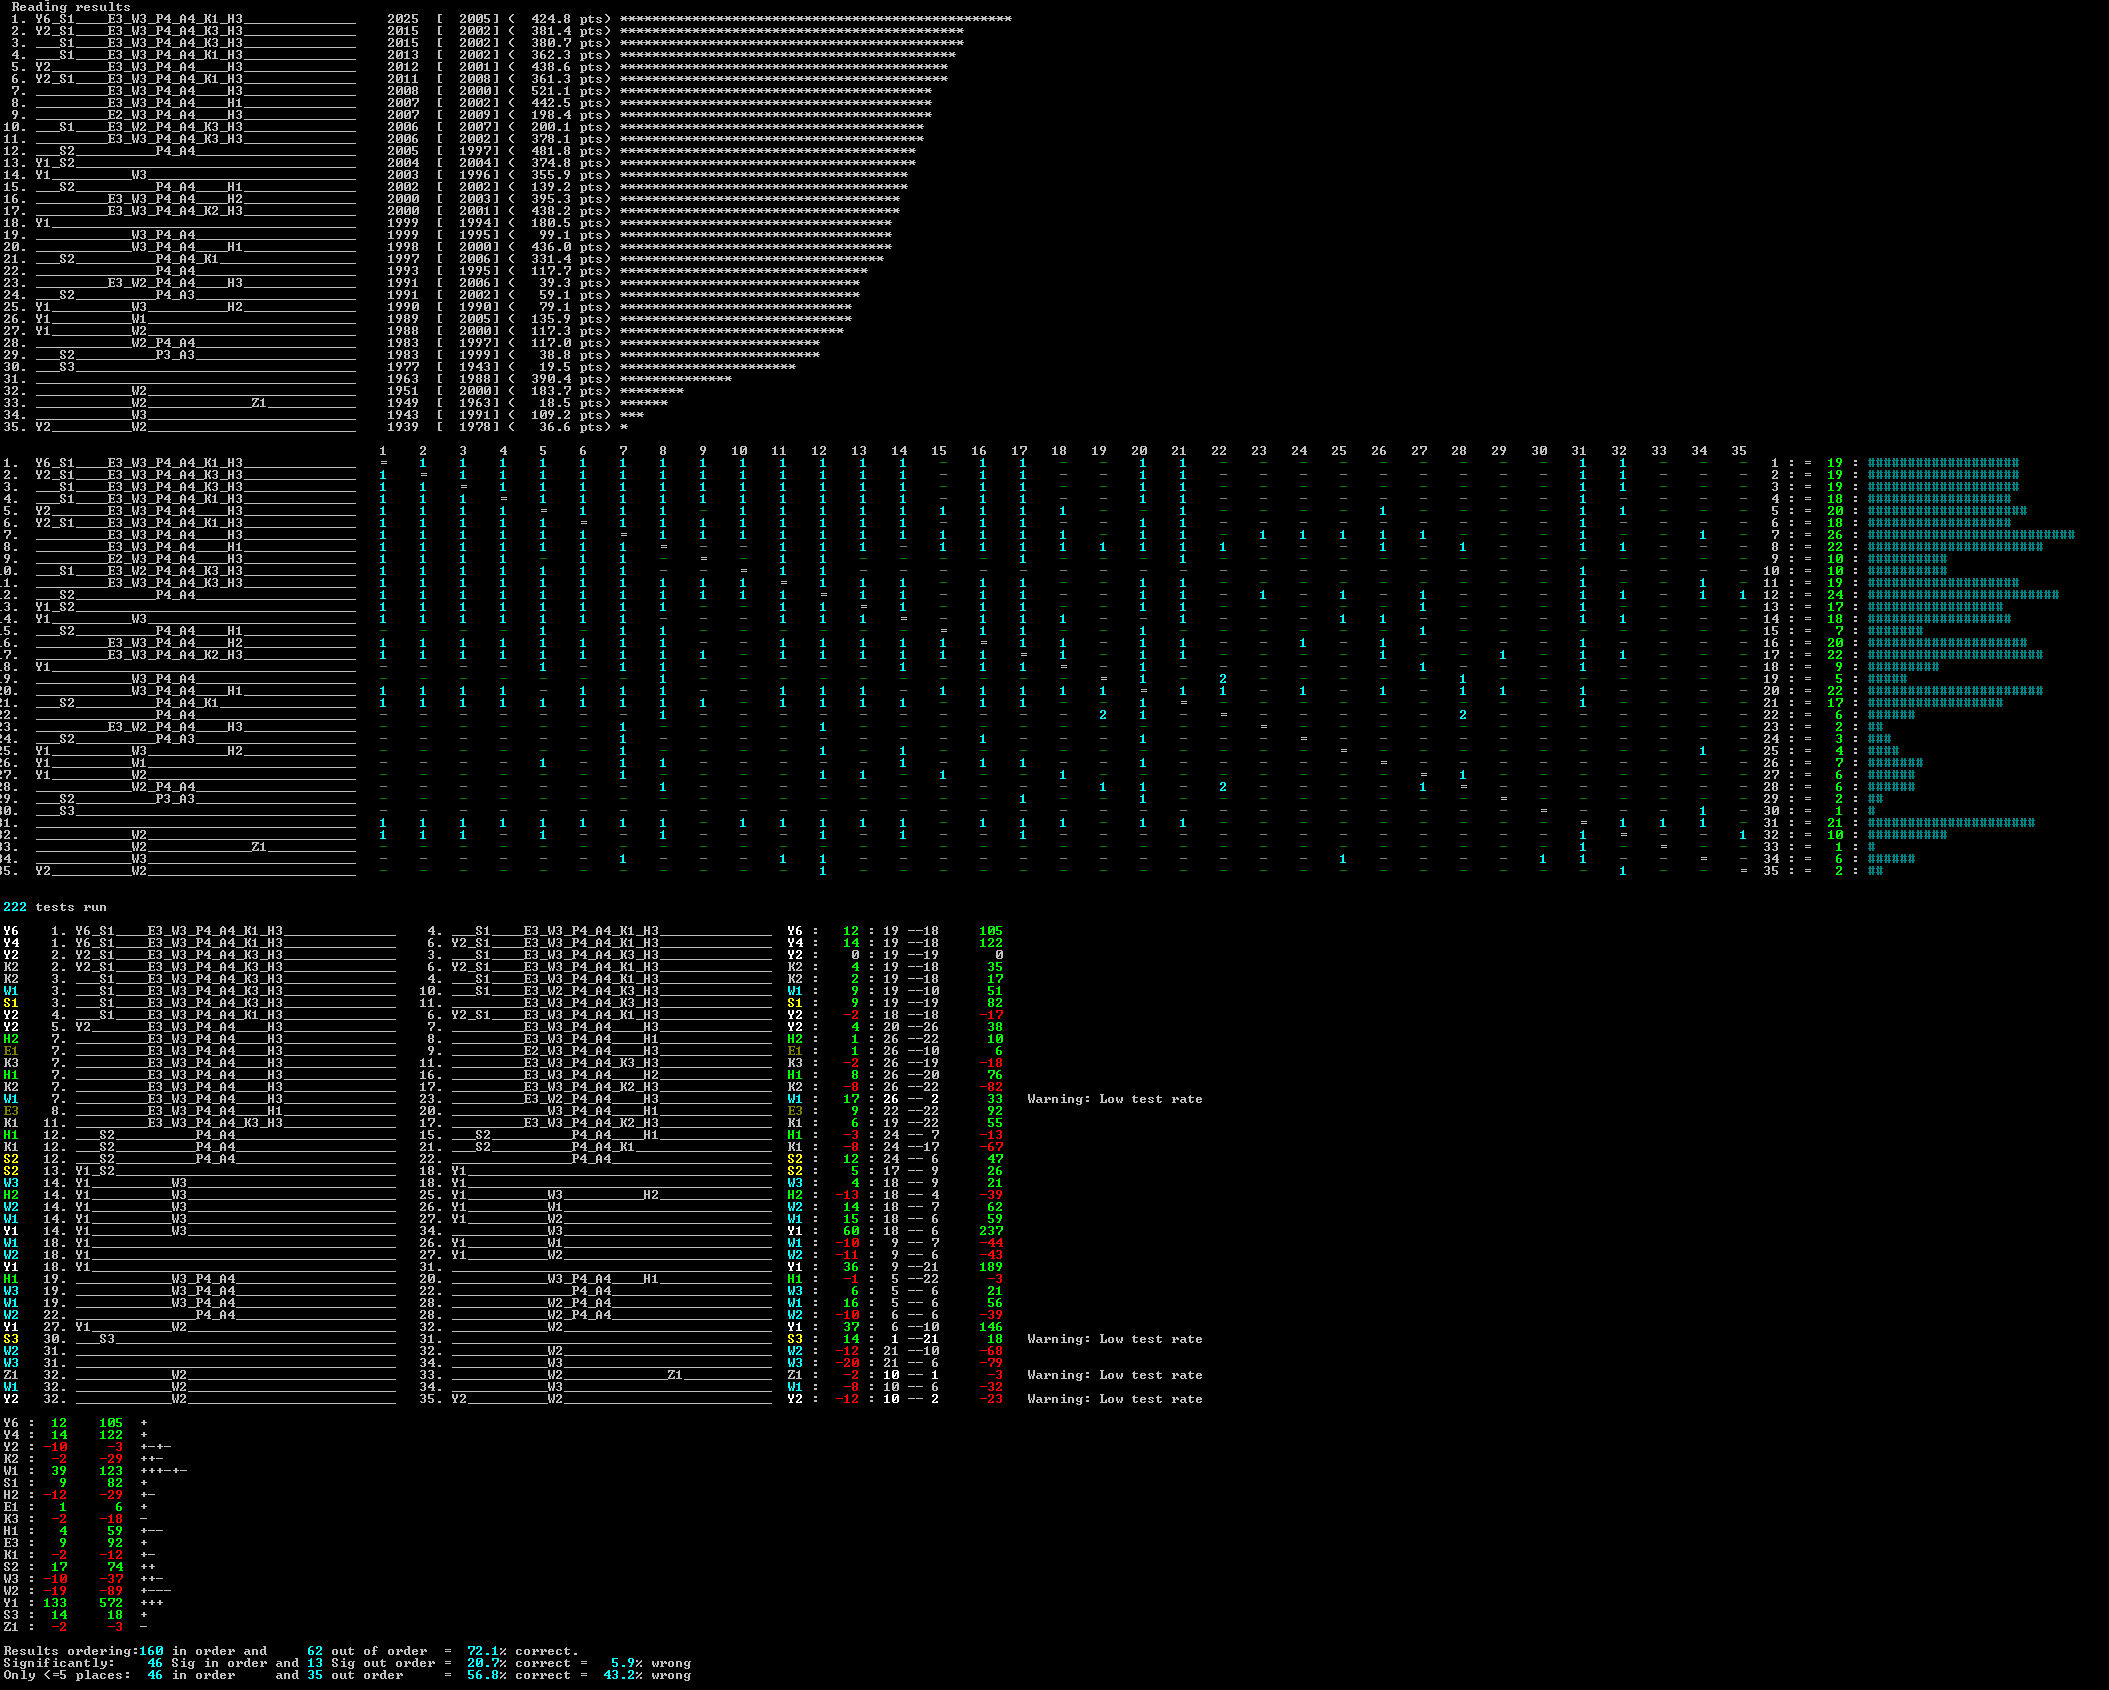
The run above played 4224 hands twice (swapping sides) for each version test run, giving a total of 1,875,456 played hands for the entire test.
We have asserted above that we need to run more tests than we would for a perfect information game. To assess this, we can look at an extended match between the top ranked and third ranked versions, which are separated by a significant point difference. If we plot the difference between these against the numbers of hands we can see how quickly the result converges to show a clear difference, as follows:
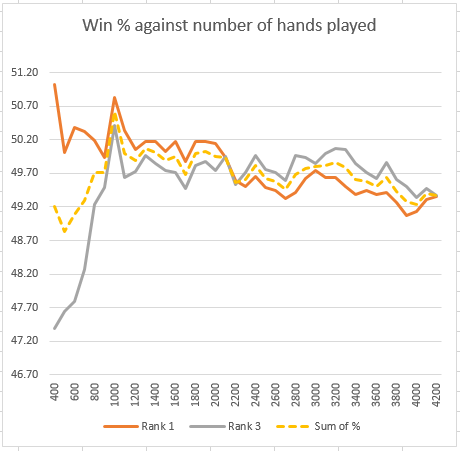
This shows two plots. The Y-axis is the percentage proportion of total points earned. The X-axis is the number of hands played. The versions tested are:
Rank 1 : Y6_S1____E3_W3_P4_A4_K1_H3______________
Rank 3 : ___S1____E3_W3_P4_A4_K3_H3______________
The orange plot Rank 1 is the top ranked program playing for deal side A with Rank 3 as deal side B. The grey plot is for Rank 3 playing side A and Rank 1 playing side B. i.e. they have each had a chance to play with the same side of each of the deals. The yellow dotted plot is half the sum of the two plots. You would expect that each of the plots would obviously level out as the total number of hands played reaches 4200, but they do not. This implies that the noise from the randomised hands is very significant in drowning out the core win percentage.
Conclusion from this plot above
Rank 1 overall shows a significant rating advantage of 10 over the Rank 3 version when assessed in tests against 19 opponents, but here, when playing Rank 3 directly, there is no advantage. Worse than that is that if we had stopped after 1800 hands it would have registered a significant advantage. By 2600 hands the position is completely reversed.
This implies that the entire test size to get a single stable test result must need 10,000 x 2 = 20,000 hands or maybe much more. That is a huge number of hands played for a single head-to-head test.
However, note that Rank 1 overall shows a significant advantage over the Rank 3 version when assessed in the full block testing, derived from assessing 1,875,456 played hands.
These are huge numbers of tests compared to the numbers considered for perfect information binomial tests, where a large advantage might be resolved after as few as 50 tests and a small advantage inside 500.
For the developer, this means running many more tests than would be expected. If the gain in strength is relatively small, then the number of tests required to validate it would rapidly increase.
Assessing the impact of testing against a variety of opponents
The large table above also includes a final summary table that assesses the impact of testing against multiple versions. The reason for needing this is that commonly you will find test results such as A > B, B > C and then C > A, as each version has some particular capacity to exploit a particular version's weaknesses. This final table attempts to quantify this by showing how often a head-to-head result is at odds with their relative rating.
In this case, across the entire table, 72.1% of the rating ordering has the same ordering of the head-to-head result. That sounds like a disquieting lower success rate than one might have expected, but it is actually worse than that. The cross-reference includes comparing versions at the top and bottom of the table, which you would be sure you would have the same result ordering. However, these results must surely already be a given.
The table also includes a narrower comparison where only versions <= 5 places apart are compared to the head-to-head result. Then the performance drops off significantly to just 56.3% matched.
This must partly be due to particular characteristics that allow particular versions to have particular success against selected opponents, but it must also be because the sample test sizes were not enough to derive definitively correct results.
Conclusion
The overwhelming drive in this system is to optimise the testing procedure to gain the maximum information for the minimum of tests. In this case the imperfect information test shows that each test was not sufficient to get a reliable test result. However, if we double the number of tests per trial then we only have time for half the number of tests. This type of issue is discussed at length in Digging further into the Statistical Abyss, where empirical tests have been run to demonstrate the impact of partitioning results to reject early test failures. The mathematics of this is not presented, but the empirical test results show that the method is valid. The end product is simply a better chance of identifying the strongest version.
The same principal applies here. These "shorter" tests allow partly accurate results to be derived, which can be used to steer follow-on tests, even though the results are imperfect. Any version that does not deliver a strong result in a particular test can still redeem itself because it may be re-cycled into providing an opponent in a follow-on test. In this case a strong result will skew the rating such that the earlier poor result is compensated for.
The mathematics behind this is a bit beyond me, but the empirical results justify the method.
The final conclusion is that testing imperfect information games adds a significant burden on the volume of testing needed. To make it manageable and efficient you will have to carefully examine how you can best process and structure results. The system tool used above to create these tables substantially contributes to making this efficient.
Jeff Rollason - August 2017