Copyright Notice: This article is Copyright AI Factory Ltd. Ideas and code belonging to AI Factory may only be used with the direct written permission of AI Factory Ltd.
This article comes backed with the results of a user experiment with random numbers. From previous article themes you will have seen that the gap between real random numbers and user perceived random numbers is significant and that this is more than just a curiosity but actually an issue. Some users even campaign against us because our game random numbers are perceived as being non-random, at the expense of the player!
This article tries a little experiment to see how human perceived randomness might differ from machine randomness.
I have used our own limited bespoke text-based plots here as Excel does not quite offer what we needed.
The Human Trial
Our entry point here was to run an experiment asking users to generate a stream of random numbers. This task is potentially fraught with issues as a human will tend to make a succession of decisions rather than generate "random" numbers. This needed to be presented in a way that would induce users to generate numbers they "felt" were random.
Step one here is to reveal how this test was presented. Below is the invite e-mail, whose wording is quite critical:
| I publish 4 articles per year and a coming article on the analysis of human randomised numbers needs a little real human input. With a couple of minutes of effort you may be able to make a useful contribution: | |||
| What I simply need is for you to reply to this e-mail and simply randomly type around 200+ digits in the range 0->9 into the e-mail. So this might look like the following: | |||
| 391725348940101265282304782512417830745296305462981201075320673654 301044637395637485962279405027253485017365023756623218402853707293 467452529401628402540272540670825210340671438506169301383793910420 5931 |
|||
| Ideally I suggest you do this from a keyboard with a numeric keypad, with numbers laid out like this: | |||
| 7 8 9 4 5 6 1 2 3 0 |
|||
| However numbers from the top line of keys also works. | |||
| Your aim is to simply tap away creating a series of digits that you feel are "random". Don't think about this and best do not ask advice from anyone else about what you should type. Also, do not look at what you have typed while typing. The key is that this comes from just you. | |||
| Many thanks if you can provide your input! | |||
This was sent to several friends and from these I received 20x sets of data giving 5859 randomised digits. In each case I only asked for about 200 digits. It sounds like I could have asked for more, but this would likely be counter-productive as after about 200 numbers users might become fatigued and distracted and very likely the nature of the numbers typed would change. My selected audience was also not random but steered away from those with strong computing or mathematical backgrounds as I was sure they would think too much about the experiment and try and mentally adjust what they typed to conform with what they knew must be the characteristics of real random numbers. I wanted instinctual rather than analytical data.
What I needed was an input that linked to the instinctive perception of randomness rather than any analytical synthesised distribution.
Ok that is the premise. Now let's see what happened.
The Human and Computer Results
I have 3 charts in each test, one using the human dataset, one using the standard C library function rand() and one using AI Factory's random generator CFRandom as a control.
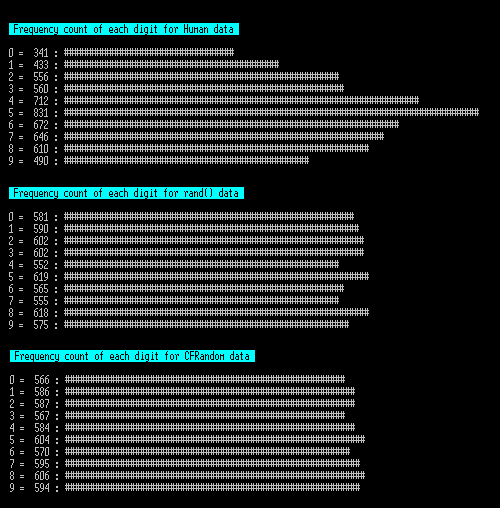
The charts here show the raw distribution of each digit type. As might be expected the human chart clusters around "5", which is the middle of the keyboard. My test did invite the use of the numeric keypad, which would have made the digits more equidistant, but most users will have used mobile phones. Therefore, this skew was inevitable. People will naturally hop between the middle and edges of the keyboard. At least this did what was expected.
Note that the results for rand() and CFRandom trial above are not exactly the same, but this is a small sample. These were repeated for a dataset 10x bigger to affirm that these both converge to the same profile. Without this the above might look as if it had some significant deviation, but this is spurious.
This next chart looks at the frequency of repeating digit segments, i.e. 2, 22 , 222 etc. A truly random distribution will show a double digit every 10 digits, but you can see here that the human chart does not show this, by counts of 324 to either 448 or 472. Taking 324 and 448 shows that the chance that this shows that humans here is showing less double digits is 99.9996%. Again this is not unexpected as it is natural to choose a different key rather than press the same one twice.
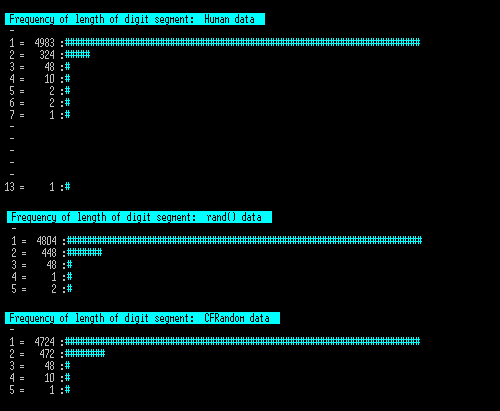
Note that the human trial shows digit sequences of 2,3,4,5,6,7 and an odd 13, whereas the computer trial only showed 2,3,4,5. This is hard to explain other than that the human user wandered around in their behavior. The sequence of 13 is odd, and we might have been tempted to remove that one dataset from the 20 sampled as this is not random behavior, but this was what they did and if we deleted it then the rest of the whole test is invalidated, so was kept in.
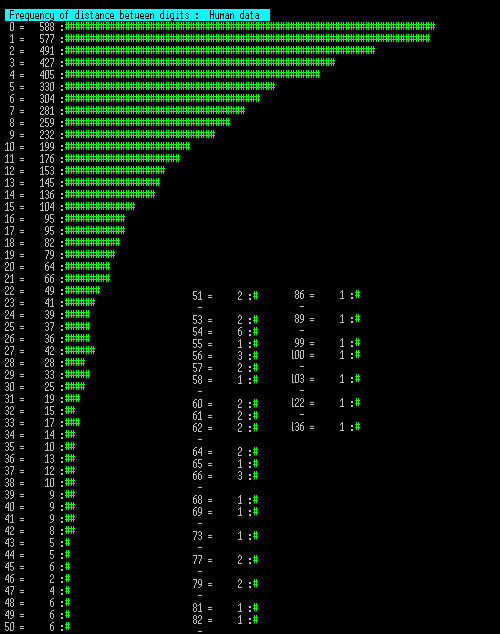
The next 3 charts show the number of times a distance between the same digit occurred, so if testing "1" then scan through the list measuring the distance to the next "1" and counting that distance. This is then repeated for the next "1" etc.
Since these tables are long I have wrapped them into multiple columns. Note that an entry marked "-" may mark a long sequence of no data, so this is collapsed into a single entry.
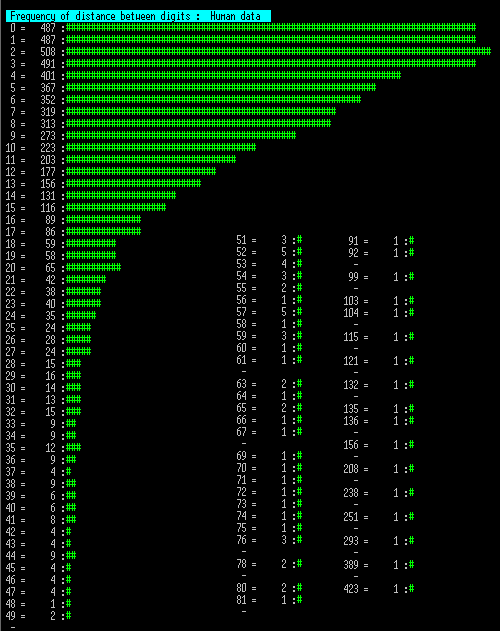

Now these show some significant difference between human and machine. Note these charts are longer as large gaps between the same digits were more common.
The 2nd and 3rd machine charts were repeated for 10x the number of data points and these showed convergence, having the longest sequence as 123 and 127 length data segments, so that any slight deviation above is spurious.
However the human data set does not tail off from zero, as the machine sets do, but actually seems to show a block where 0,1,2 and 3 distance counts are similar. More significant is that the longest segment is 423, with 10 segment lengths greater than the upper ceiling of 127 for the longer machine trials.
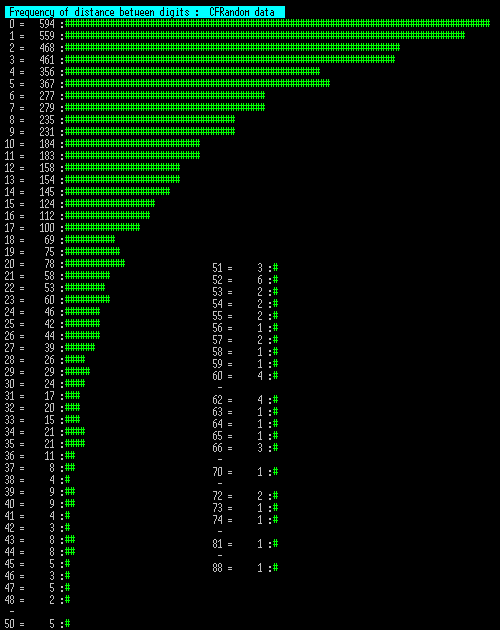
If the reader is still following this, then perhaps an obvious flaw in this summary is that the distribution of human choice of digits is not random, dictated by the keyboard layout. So perhaps this deviant distribution is the natural emergent property of this skewed distribution. For certain the lower number of 0 and 9 digits will encourage bigger gaps between successive digits.
To address this concern, I ran a machine trial that picked digits with exactly the same distribution proportion as the human trial, so with the same lower proportion of the digits at the edge of the keyboard that was shown in the human data. This came out like this:
The striking obvious feature of this is that it looks much like the other two machine runs (and not like human run), but that that longest segment stretches to 136. Repeating on a 10x set this extends to 183.
Looking at this final plot of skewed machine digits and the human trial, we can compare some results, as follows:
0 length segment: Human 487 to machine 588. 99.8969% chance not spurious.
1 length segment: Human 487 to machine 577. 99.7103% chance not spurious.
3 length segment: Human 491 to machine 427. 98.2649% chance not spurious.
Segment length zero is already not significant because of the inclination not to hit the same key twice, but segment 1 (e.g. xx2x2xxx so a digit repeats after one other digit) is outside the bounds of chance. The segment 3 is within bounds, but is a swing in the opposite direction.
Finally the longest segments are clearly much longer, showing a clear inclination to patterned ignoring of some digits from time to time.
Extra Pattern Trial
A late additional trial was requested to ask users if they also could examine 3 randomised plots in a 2D space, where:
| (A) | Which prevented any randomised point being near a previous randomised point. | ||
| (B) | Which was totally randomized. | ||
| (C) | Which added a condition that any new point would not be exactly next to a previous one | ||
This might have exposed an inclination to reject any random clusters in the plot. However we only had 9 results, where 2 chose the unclustered "C" and 7 correctly chose "B", and so I did not pursue this for more results.
Conclusion?
This was an open experiment, whose outcome would be far from certain. The motivation to do this was to see if we could demonstrate that users would subliminally filter out repeat patterns from their typing in their attempt to be more "random". If they had done so it would have shown that they naturally avoided anything that looks like a pattern (such as a repeat sequence), even if that was actually a non-random deviation.
Unfortunately, the setup was inevitably a little flawed in that users will probably avoid hitting the same key twice, and that is exactly what they did, but this probably does not link to any perception of whether common repeated digits are evidence of non-randomness. The frequency of triple digits was the same as the machines.
The frequency of distance between digits showed that the pattern DxD (digit followed by another different digit, followed by the first digit, was clearly much lower than a random difference, so this offers limited evidence that the humans proactively filtered out this pattern.
So Why Were We Looking?
As indicated in the article header, perceived randomness is an issue with some of our users. People see cheating where there is no cheating and non-random rolls when they are random. Perhaps the inclination of humans to see patterns that are not there is an innate property of all living things. That is what we had in mind.
The thesis here is that humans see patterns where patterns do not exist. This may sound an irrational idea, but there is a rational plausible reason why this might be so. Whatever humanity is now, it is taken as a given that it is driven by Darwinian evolution, so any characteristic we have, even if superficially defective, would have had to have a positive survival component.
If you look at pattern matching in primitive man, he would face dangers. Part of this is the fuzzy detection of danger. The pure matching network in the brain might have a mathematically correct assessment that there is a 5% chance that the trees ahead are hiding a tiger. If that was passed as-is to human consciousness as a small chance of danger then this is no good as that might be a 5% chance of death. If this situation is repeated many times it might even translate into an eventual near certain death. Clearly it is a survival benefit to be over-sensitive, so that 5% danger reaches the conscious decision making process as a "serious danger". This seems to be a commonsense idea.
It is not hard to imagine that this survival-driven over-sensitivity to patterns might be the norm and may be why users too easily see things that are not there. This tendency may also contribute to the ease that people subscribe to absurd conspiracy theories.
This might be a significant root issue why we, and other game makers, suffer at the hands of the customer's belief that we cheat. However that is just part of the issue. As detailed in previous articles, there is also an issue with humanity's difficulty to intuitively understand probability theory at all. Our article Digging further into the Statistical Abyss details this at length.
It was an interesting experiment to try, but we did not deliver any clear supporting evidence that humans skew to expecting a randomized distributions to show below random filtering out of patterns.
Jeff Rollason - March 2017