Copyright Notice: This article is Copyright AI Factory Ltd. Ideas and code belonging to AI Factory may only used with the direct written permission of AI Factory Ltd.
In an earlier article "Developing competition-level games intelligence" (Spring 2005), there was a short section titled "statistical minefields". This warned about how easy it can be to be mesmerised by limited small sets of play results. The context was concerned with developing the AI of a competition-level program. This article takes the subject further and also offers a freebie stats analyser that we commonly use for assessing statistical test results. This is a useful tool and removes the gloss from misleading figures. If you mail us, we can send you a copy of this.
However this is just the start. The binomial distribution will stop you seeing something when there is little there, but real world testing of competition AI does not totally fit the pure random independent assumptions of the binomial distribution. Also, when you are dealing with multiple result sets, the simple assumptions you may have made might further break down. This article looks a little further into this murky water.
Task Recap
Our interest in this topic was driven by the need to develop competition level AI. This has taken us as high as world rank #3 in Computer Shogi (Japanese Chess), where we did not even personally play the game we were modelling. The method adopted was a mixture of analysing games and conducting block testing. One problem is trying to get the most out of a very limited testing capacity. This was conducted as follows:
Rating Program Changes Using Block Testing
The snag is that the time to test one new feature requires a significant volume of results. It is not always easy to find enough capacity to completely test some feature. Added to that some feature may only work when combined with other new features as well. Trying to manage this is tough as you are forever faced with "what to test next". The system employed was to have an automated system that attempted to cross-reference all results, where any version may play any version. This would track what features each version had and then predict the value of that feature, depending on the current rating of that version. A version was rated using an ELO-like rating system, which was sensitive to linked results. E.g. If A beats B by 60% it gets a rating, but if B then beats C, then A's net rating increases.
This complex system squeezed the maximum from the minimum data and allowed us to progress to rank 3 in the world.
This all "worked". However it was complex and the statistical validity of it was suspect. We did get competition results though.
Using The Binomial Distribution To Assess Results
Simplifying this down to a verifiable procedure, there are standard methods for objectively assessing the test results. For a two outcome game test, the binomial distribution will allow you to assess the significance of the result. For this we use the command line BINOM.EXE, which I will supply to readers who want to use this. This accepts 2 parameters for wins by A and wins by B and then shows the probability that the result is significant.
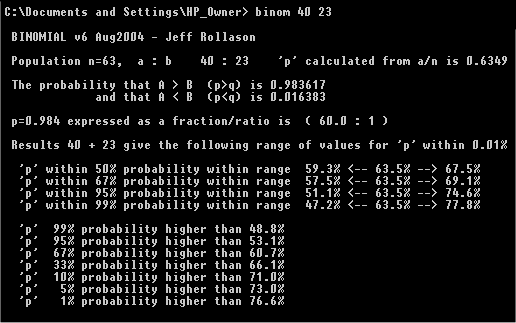
In the screenshot below the tests result of 40 wins and 23 losses can been input on the command line. From the output this gives a probability of A stronger than B of 0.983617 or about 98%. This is further broken down to give other strength probabilities. These include the probably ranges for "p" and "q" (probabilities of events A and B for an infinite set of results). This is achieved by sampling different values of p and q to test the ranges.

This provides a simple test for a simple one-to-one run of results. This allows you to choose to control when a test run is stopped, once sufficient confidence bounds have been reached.
However, as intimated above, you need to do tests against multiple opponents. Given that, unless you have many test machines, you may have to commit to a long run for just one test before another is tried. Ideally you want to test against multiple opponents at once, to get a broad assessment of the performance early on. This may be difficult to arrange.
This is where our generic testbed suite comes in useful, as follows:
Round-Robin Tournament Testing
From other articles you will see that our generic testbed allows round-robin version testing. This is very convenient as it is so easy to set-up and can be left running long-term to test changes. It was designed at first to provide a means of testing play strengths, so when you provided a product with 5 play levels, it was possible to measure the relative strength of each level. This could be completed by single tests of (say) 1 vs 2, 2 vs 3, 3 vs 4 etc. but this can be misleading as a stronger version might not do so well against weaker play than some other less strong version. In playing a large round-robin tournament you get to play each level against all other levels. This provides a more meaningful broader test of the overall ability of each level.
Using Round-Robin For Version Testing
This where we come in with version testing. From the previous article you see that A vs B testing can be deceptive. You need to find out how well your program does against more than one type of opponent. An easy method is to have a list of program versions set in a tournament. When you have new versions to try you can add them to the list, remove others and let them play. To add variety you can leave in some quirky versions to ensure some variety of opposition.
This is not perfect. It is run entirely within a single EXE and each version is derived from a single source with variable switches to enable or disable features. It is also possible to link totally different engines into this framework, but a single source with switches is a convenient mechanism.
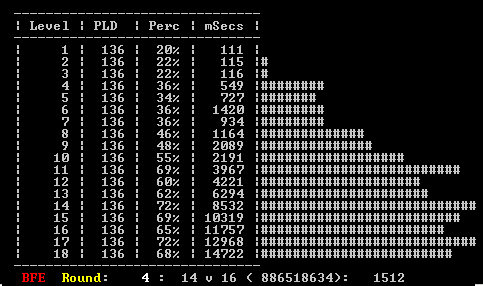
The graph below shows a reduced table output. This example has 18 versions, which are labelled 1-18. In this instance this play levels are being tested, so level 1 is weak and level 18 strong, but these "levels" can be mapped to anything. This is a snapshot of an incomplete test, showing the results from 4 complete rounds and indicating that level 14 is currently playing level 16.

This provides a very crude barchart, so that you can get some instant visual measure of the results. The chart shows not only the win rate, but also the mean time per move, which can be important if an otherwise suitable performance is undermined by too long a move time. For example test "6" above clearly takes longer than the equally strong level "7" above.
Assessing Round-Robin Tests
This is where more pitfalls arise. In the initial block testing described earlier, using ratings, the system seemed to approximately work, but had a limited statistical basis. If you run a test for multiple versions, then using the binomial to assess each individual version result loses some validity.
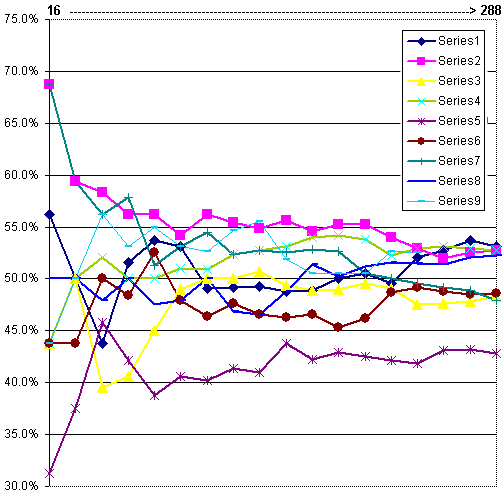
For example consider the graph below, which plots 9 program versions at 16 game intervals (each version plays 1st and 2nd against each other version). The final plot point corresponds to 288 games per version (a total of 1296 games). This set of test results has been taken at random. Here, any of these might have been the target best version. In which case identifying one that appears to perform very well or very badly may be unsound. For example Series 7 below scores 68% after 16 games (11 wins and 5 losses), giving an initial binomial probability of 93% chance of scoring more than 50% against all other versions, but actually ends on 48%, putting it in the lower half among the others.
The point is that if you test multiple versions, then it is likely that at least one will show some abnormally high or low performance. Picking out the one promising result and slapping the binomial distribution to assess it is of limited validity. Picking and assessing just one version from 9 competing versions requires a more rigorous and complex statistical approach.
However examining the visual plot below also shows results eventually clearly converging. This offers a touchy-feely way of assessing significance. It seems compelling that versions 1, 2, 4, 8 and 9 have solidly grouped at around 51%-53%, whereas versions 3, 6 and 7 have clustered at around 48%, with version 5 isolated at about 43%.
This is hard to reliably assess. If you mask the graph and progressively expose the results, at what point can you feel confident that some clear result is emerging? After 128 games per version (8th plot point) the results are starting to look fairly flattened out. You might therefore write off version 8, as it is in 8th place at just under 47%. A binomial assessment offers a 25% chance of it being above 50% and less than 8% that it would actually match the highest percentage achieved after all 288 games.
From this you might have selected the best 4 from the 9 and rejected the rest. However these 4 would miss 2 of the eventual 5 top versions and contain one dud (version 7).
This is disappointing, as to reach this point required 288 test games, which at Shogi competition time controls would need about a 6 day run.

From this it is probably necessary to avoid permanently rejecting test versions early. Note that it is beneficial to keep poor tests versions for future testing, just to give new versions some variety of opponents, and therefore give a broader measure of future versions. A version that defends weakly may expose a future version that over-extends and get into difficulty over-pressing attacks.
Implementation Pitfalls
The notes above do not provide a definitive plan for version testing. However running a consistent scheme for testing multiple versions is probably better than running multiple ad-hoc one-to-one tests.
Of course running auto-testing of multiple versions within a single executable also invites implementation errors. One easy-to-make mistake is to have a single shared set of search tables. For example: the hash table. You could clear the hash table between moves, but then this loses much valuable information between moves. However leaving a single common shared hash table is also very suspect. A particular version may make a poor job of feeding the hash table with good new moves, but is compensated by re-using moves found by the competing version.
The answer is to keep separate tables. If the table is static, then it needs to be copied after each move is played.
This article does not offer definitive procedures, but does warn against over-reading test results. If you run 64 games and think this provides a reasonable basis for assessing a version, then think again. 64 games is reached after plot point 4 in the graph above, and the "winner" at that point (version 7) eventually finished 8th out of 9 tested versions. I'm afraid caution is needed!
Jeff Rollason: March 2008
