Copyright Notice: All code and ideas expressed in this article are, by default, Copyright AI Factory Ltd. You may use these, only with the direct written permission of AI Factory Ltd.
This is a continuation from the earlier article Intelligent Diagnostic Tracing.
The previous article looked at the creation of console apps under the AI
Factory testbed environment. This demonstrated the use of multiple tracing
levels with embedded colour text tracing, available to any code developed
under the testbed. However behind this are the testbed consoles, which provide
ready-made control of your application. This article looks at this and other
additional diagnostic mechanisms provided.
The first of these is the top level main testbed console.
The Main Console
The AI Factory testbed environment provides immediate console access to your program. This requires that you embed access to your program using the generic Fb_CalculateMove. This sounds highly application-specific, and even just geared for classic parlour games, but actually fits many types of application very well. This was used for the modelling of the Aquarium, at detailed in Emulating Biological Systems in this same Newsletter issue. The second key function that has to be supported is Fb_PlayMove, which will take some single game step or move and execute it. With these in place, the console will allow you to step backwards and forwards through a move/stage history, so that your application effectively has a takeback or rewind function. Complete game states can then be loaded and saved for analysis.
This leads on to the main diagnostic commands:
The Console-Controlled Debugging – Using Game-Specific Controls
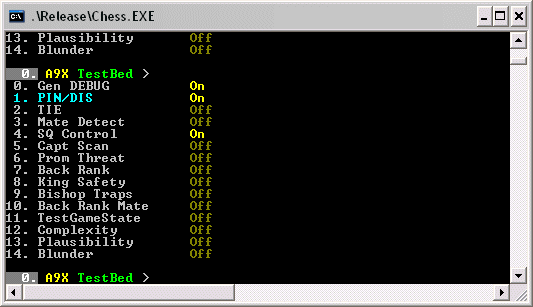
The generic console allows the used to create a set of defined named switches that the user can use to turn on and off specific tracing. This is through the CTRE+E command, which allows diagnostics and features to be enabled and disabled. For example in Chess with have:

Here it is being used to toggle the display of detailed diagnostics for specific parts of the evaluation. This can also be used to selection evaluation features. To support this the programmer needs to define an array of strings for the selected options and define constants to link to this. Thereafter the programmer can reference this within the engine code with references such as:
#if TRACE_LEVEL
Here the condition references both the default “KSw_DEBUG” and specific “KSw_CaptScan” switches before providing a diagnostic. Including “KSw_DEBUG” in all references allows all diagnostics to be switched on at once.
This is flexible and provides the user with extensive control of tracing. However the testbed has easier ready-made tracing control already provided, that needs no complex embedding of tracing statements or use of conditional compilation, as follows.
The Console-Controlled Debugging – Using Generic Switches
From the previous article you may be aware that the colour-supporting printf macros provided two levels, printf and _printf. This could be controlled by a TRACE_LEVEL #define, but actually can also be controlled directly by the console using CTRL+T. This allows all _printf commends to be toggled on and off, without needing to resort to re-compilation. These diagnostics can also be embedded in the source without needing any conditional compilation or conditional code to test switches. It is therefore an immediately accessible diagnostic trace that requires no special effort by the programmer other than to select either printf or _printf output. In practice this can be used to just provide more detailed diagnostics than the scheme above, but the above can also be used to control sections of _printf diagnostics as well (i.e. using CTRL+T to turn on additional tracing for the already selected trace component selected).
Extending the Console Command Set
The above commands are designed to trigger diagnostics before a “move” is calculated. However simply turning switches on an off is almost certainly not enough. To develop a game engine, the programmer will need the capacity to test small parts of an evaluation or to dump specific tables for assessment. To support this the generic testbed console passes all commend input through the user function “Ft_ExtraCommands”, which can be used to extend the console command set. Note also that this can also be used to override the standard commands, such as the “H” command that displays the move history. This might be replaced with a more comprehensive move history display.
Embedding Console-Control Inside The Engine
The above regime allows the programmer to enter commands before and after requesting a move calculation. However once the move calculation is started, then the programmer needs to wait until completion before they can make any changes.
An extension provided here is the generic “Fb_Console” that can be called by the game engine directly. As soon as this is entered, the console allows diagnostic commands to be entered, and special commands executed (such as table dumps). Execution does not return to game engine until the programmer exits that call of Fb_Console. This console can be limited to be called at conditional stages, or can be set to trigger entry if certain conditions are reached (such as a programmer detected overflow).
The full console set above gives the game engine developer off-the-shelf access to diagnostics. Of course the programmer can already use standard debuggers to provide total control, but the output from these is invariably difficult to read, compared to tailored diagnostic output, and has only limited availability for conditional breakpoints.
Embedding Programmable Breakpoints
Tools such as VC++ provide powerful debugging that can run an application and stop it at the exact point that some key failure has occurred, such as a corruption. This is great and can be the best possible way of tracking down a fault.
However life is not always so simple, and many programmers that use this will be familiar with the situation that the application fails in “Release mode”, but as soon as the “Debug” is tested, the problem goes away. In consequence the debugger then becomes totally useless.
Add to this that the debugger trap of some corruption can be painfully slow, to the extent that it becomes too slow to be usable.
An alternative solution to this is to have a procedure call embedded in your code that provides a programmer-controlled diagnostic test, as follows:
debug( __LINE__, __FILE__, x)
This uses the VC++ macro “__LINE__” and “__FILE__” to provide the current line number and filename and parameters to debug, plus one additional parameter “x” for some value to be displayed or tested.
If the trace is not required, then the user needs to include the define:
#define debug(x,y,z)
which simply macros-out the debug command. When it is needed the debug command can execute any program test, that might exclude tracing on selected files, using __FILE__, or even conditionally test the extra provided parameter.
The advantage of this is that this allows a “Release version” to be debugged, and is also much faster than a standard debugger. Of course it only tests at the point it is referenced, but the programmer can easily start adding additional references to the debug call, once the area of the problem is known.
The above technique is almost certainly in widespread use, and is not a feature of the AI Factory testbed as such, but a useful additional diagnostic aid.
Handling Bulk Diagnostic Output
Sometimes simply viewing a trace is not enough. The potential output may be too great to observe directly, so a means is needed to automatically process this. An ideal option is to re-direct output to a file. The standard testbed console provides this, so the programmer can switch to file dump, rather than console output. This strips out colour output, but now the trace can be searched for key strings.
The problem maybe unknown, but that just something is broken. Using file dump between versions allows a dumps to be diffed, which may show that after 10,000 lines of trace, that some number changed, and point to the fault.
Tracing Procedure Calls
A fault may occur in a program, but sequence that gave arise to it maybe unclear. Perhaps a succession of procedures were called before the problem happened. The generic macros used by the testbed provide the following:
pe(functionname)
This pair of macro references are used to mark the single entry and any exits to all procedures. These are passive unless the define “TRACE_SHOW_PROC” is set. If this is set then each time a procedure is entered then the following output occurs:
---> functionname
on exit it displays:
<-- functionname
Added to this, each time a function is entered, the output indentation is increased, so that you might see:
---> function1
This provides an output where the path that the program took is made clear. For example, this may show that some procedure that should have been called once, but has actually been called twice, or that some procedure failed to be called or was called out-of-sequence.
Conclusion
The value of the testbed architecture above is that it provides a known off-the-shelf development environment to test some game. Added to this, the testbed console provides autoplay commands so that a game can be tested for bulk games. This allows testing of two versions head-to-head, but making use of testing user-controlled switches via CTRL+E.
This topic will be returned to, with specific case studies. As it is, it supports rapid engine development and linking into generic testing facilities to make assessment of game performance much easier.
This will continue to be the backbone of AI Factory engine development.
Jeff Rollason: March 2007
